
You've got a spreadsheet open, a class deadline is creeping closer, or your manager wants a quick answer from last month's customer data. You can see that two things seem to move together, but you're not sure how to study that pattern without overclaiming. That's exactly where correlational design research helps. It gives you a clean way to observe relationships in everyday settings, describe them plainly, and avoid pretending you proved a cause when you only found an association.
What Correlational Design Research Actually Means
A student notices that the people who sit near the front of the classroom often hand in stronger work. A small support team sees that longer calls often end with higher satisfaction scores. In both cases, nobody changed anything on purpose. They watched what happened.
That's the heart of correlational design research, a non-experimental approach that studies how two or more variables move together. You measure them as they naturally occur, then ask whether they rise together, fall in opposite directions, or show no clear pattern. The point is association, not intervention.
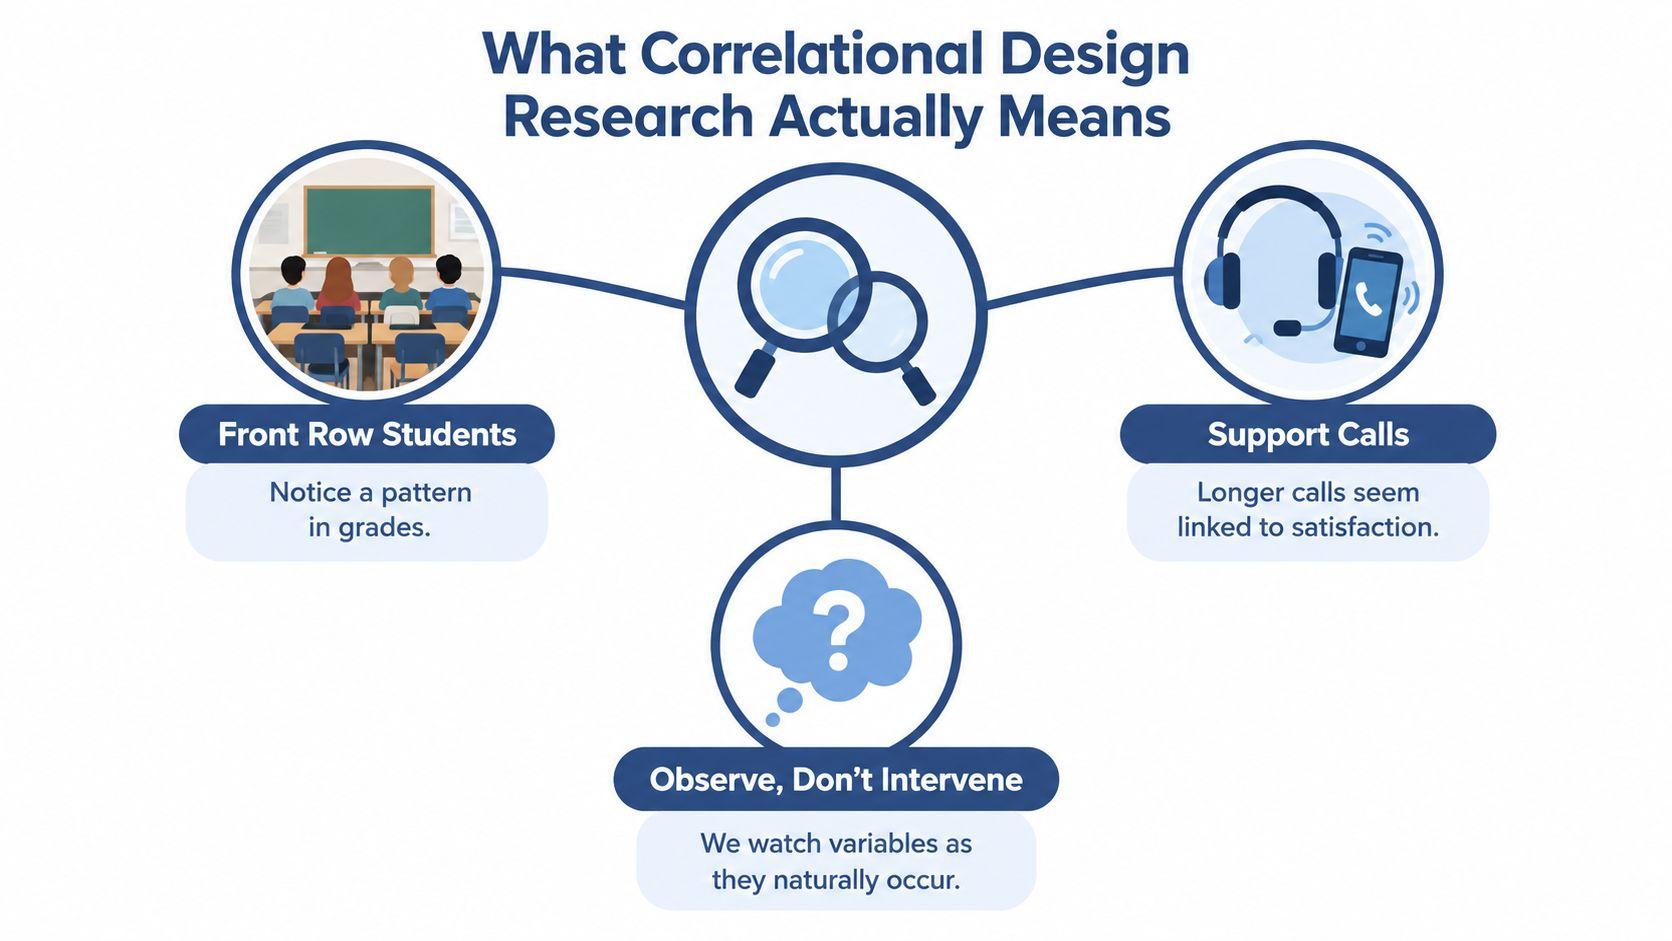
Observe, don't intervene
In an experiment, the researcher changes something on purpose and watches what follows. In a correlational study, the researcher stays out of the way and records patterns that already exist. That difference matters because many student projects, internal reports, and workplace questions can't be turned into true experiments.
Practical rule: if you're not assigning conditions, changing a variable, or controlling who gets what, you're not doing an experiment.
Correlational research is useful when you want a realistic picture of how things relate in everyday settings. It can help you forecast outcomes, spot possible risk factors, or decide which questions deserve a deeper follow-up study. What it can't do on its own is prove that one variable caused the other. That limitation isn't a weakness. It's the honesty that keeps your interpretation credible.
Types of Correlations You Will Encounter
The word correlation sounds technical, but the patterns are easy to picture once you use familiar examples. Study time and grades often move in the same direction, so that's a positive correlation. Screen time and sleep often move in opposite directions, so that's a negative correlation. Shoe size and reading ability usually don't move together in any meaningful way, so that's close to zero correlation.
Direction is only part of the story
A correlation can also be linear or nonlinear. Linear means the points follow an overall straight-line pattern. Nonlinear means the relationship bends, curves, or changes shape. That matters because a straight-line summary can hide a real pattern if the points form a U-shape or a curve.
The most common summary number is the correlation coefficient, often written as r. It tells you the direction and strength of a relationship. The value stays between -1 and +1, where numbers near the ends show a stronger relationship and numbers near zero show a weaker one. A positive value means the variables tend to rise together. A negative value means one tends to rise as the other falls.
A scatterplot is the quickest way to sanity-check that number. A few outliers can pull the pattern around. Clusters can suggest subgroups. A curved cloud of points can look “weak” if you only stare at r, even when the relationship is still meaningful.
Read the plot before you trust the coefficient. The number summarizes the picture, it doesn't replace it.
If you can describe the direction, strength, and shape in plain language, you already understand more than many first-time readers do.
Choosing the Right Correlational Design
Not every correlational study uses the same setup. A student project, a customer survey, and a sales-log review all count as correlational, but they answer different kinds of questions. The right choice depends on what you can access, how much time you have, and how sensitive the topic is.
Three common designs side by side
| Design | Best for | Main strength | Main limitation |
| Naturalistic observation | Watching behaviour as it happens in a real setting | Very close to real life | Harder to control outside influences |
| Survey-based research | Asking people about attitudes, habits, or experiences | Fast and flexible | Self-report can be incomplete or biased |
| Archival or secondary-data research | Using existing records, logs, or databases | Efficient and low disruption | You're limited by the quality of the original data |
A bakery team might use naturalistic observation to see whether loyalty members spend more when the queue is short. A product team might use a survey to check whether people who like a feature also say they'd recommend it. A finance team might mine old sales logs to see whether two products tend to be bought together. Each design fits a different constraint.
If you want a wider look at tools that support note-taking and research workflows, the comparison in best Granola AI alternatives from iScribe Live Transcribe is a useful reference point for small teams sorting through practical options.
The best design is usually the one that gives you the cleanest answer with the least friction. If you need a quick way to collect opinions, use a survey. If you already have records, start there. If behaviour matters more than self-report, observe it directly.
Statistical Methods for Correlational Data
A small team looking at study hours and exam scores does not need a dozen statistics packages. It needs the right match between the question and the variables. For correlational work, that usually means choosing among Pearson's r, Spearman's rank correlation, and point-biserial correlation.
A quick decision rule
Use Pearson's r when both variables are continuous and the pattern looks roughly linear, like hours studied and test scores. Use Spearman's rank correlation when the values are ranked, ordinal, or clearly non-normal. Use point-biserial correlation when one variable is continuous and the other has only two categories.
A simple way to sort this out is to ask what kind of data you have before you touch the software. Heights, scores, and time spent are continuous. Rank order is ordinal. Yes-or-no categories are binary. That first check prevents a lot of confusion later.
Software output usually gives you the test name, the correlation coefficient, and a significance result. Read the effect size and the p-value together. The coefficient shows how strong the relationship appears. The significance test helps you judge whether the pattern is likely to be more than random noise in your sample.
For a deeper writing and analysis workflow, the internal guide at 1chat blog can sit alongside your class notes while you draft your method section.
If you want a practical example of matching method to question, the article on predict job performance with work samples shows why choosing the right measure matters. The same logic applies here. Choose the test after you understand the variables, not before.
A clear write-up might say, “Study hours and exam scores showed a positive association in the sample, so higher hours tended to align with higher scores.” That tells the reader what was found without claiming more than the data can support.
Why Correlation Does Not Imply Causation
This warning gets repeated so often that people sometimes forget what it means. A correlation can be real and still fail to show cause. The reason is that several different stories can produce the same pattern.
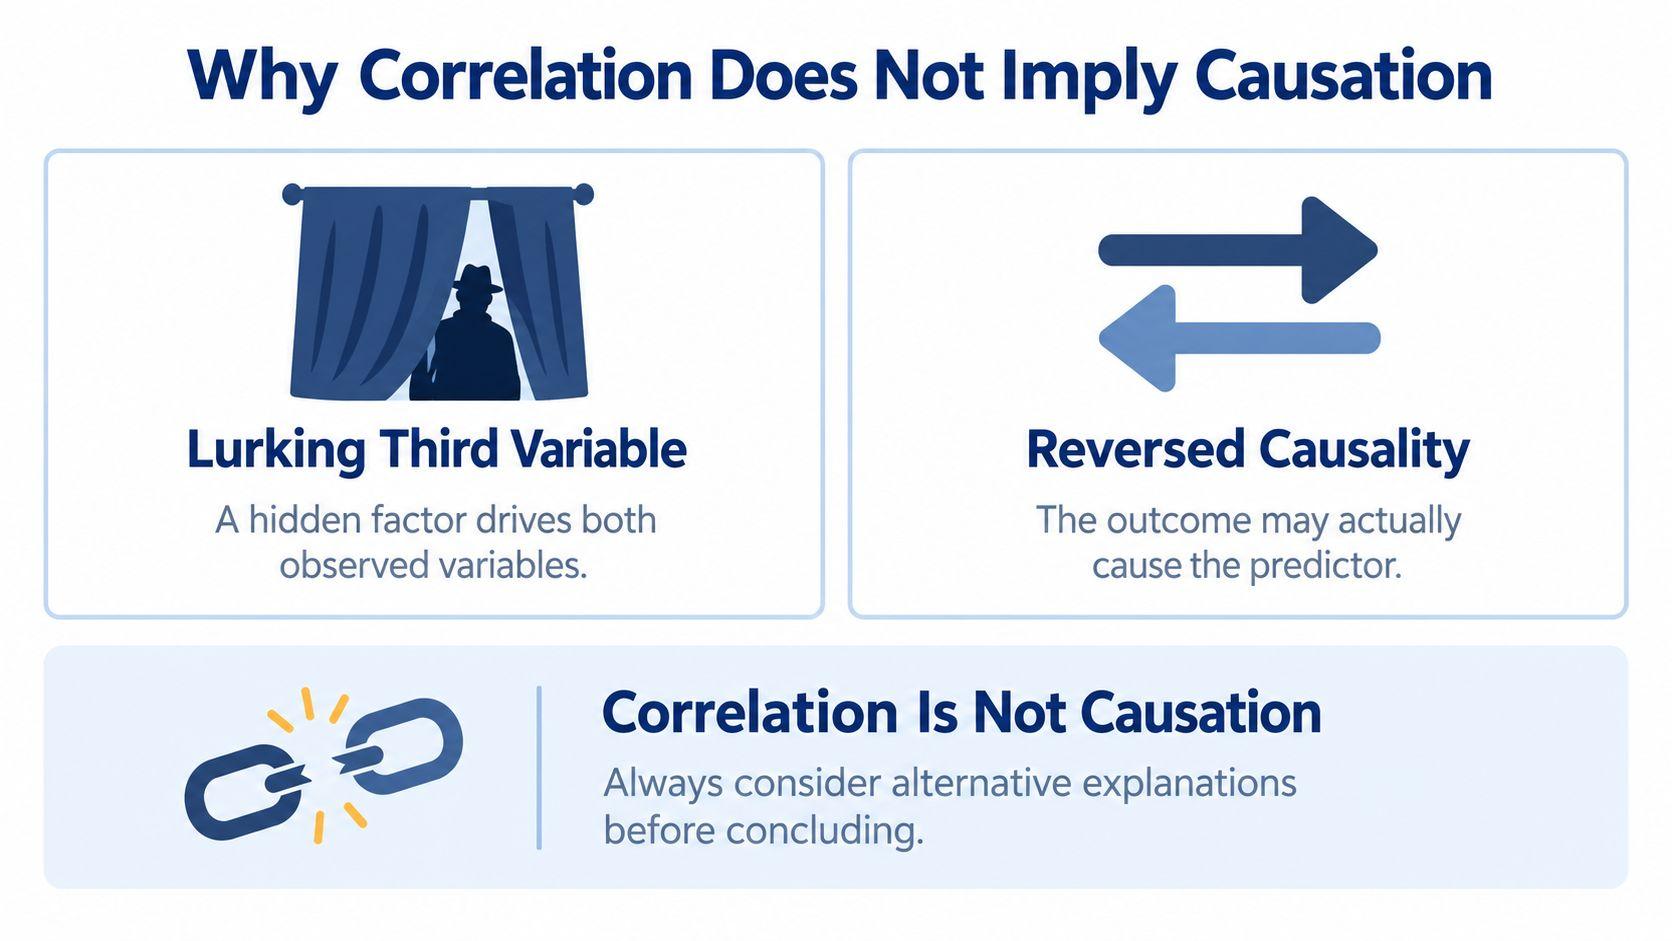
Three common alternative explanations
One possibility is a third variable. Ice cream sales and drowning incidents can rise at the same time, not because ice cream causes drowning, but because warmer weather affects both. A hidden factor can make two variables look connected even when they aren't directly linked.
A second possibility is reversed causality. Depression and sleep problems often appear together, but the direction can run both ways. Poor sleep can worsen mood, and low mood can disrupt sleep. A correlational result alone can't tell you which path is operating.
A third possibility is selection bias. If only highly motivated students apply to a study about advanced coursework, the sample may already be unusual. The relationship you see may reflect who got into the sample, not a general pattern in the wider population.
Correlation can support prediction, association, and hypothesis generation. It can't, by itself, support a causal claim. That line matters in a class paper, but it matters just as much in a team report or a dashboard readout.
If you can explain the same result with a hidden factor, a reverse direction, or a biased sample, you don't have causal proof yet.
A good habit is to ask, “What else could produce this pattern?” If you can answer that question truthfully, your interpretation will stay grounded.
Designing a Correlational Study Step by Step
A correlational study works best when the question can be measured cleanly. “Do customers like our app?” is too loose to test well. “Do loyalty members who visit more often also spend more per visit?” gives you two observable variables, so you can collect data without guessing what each side means.
A five-step workflow for small projects
- Define each variable operationally.
Turn broad ideas into measures you can record. For a bakery, “customer satisfaction” might become a 1 to 5 rating after purchase. “Spending” might mean the total basket value on each visit. - Choose the design and sample.
Decide whether you will observe people directly, survey them, or use existing records. Then decide who counts in the study. A small convenience sample is easy to gather, but it can tilt the picture if it leaves out important groups. - Pick the statistical test before data collection.
If you already know whether your variables are continuous, ranked, or binary, you can choose the right test earlier. Pearson, Spearman, and point-biserial each fit different kinds of data, so this decision belongs in the planning stage, not at the end. A good place to sort out that choice is the 1chat research resources page, especially if you are building a class project or a small team report. - Plan the sample with the analysis in mind.
You do not need to become a statistician, but you do need enough data for a result that is stable enough to trust. Too little data can leave you with a wobbly estimate that shifts a lot from one sample to the next. - Write a one-page analysis plan.
Record what you will measure, which test you will run, and how you will handle missing values or unusual cases. That document keeps you from analysis fishing, where you try one option after another until something looks good.
A simple check helps here. If the question, the variable definitions, and the test all point in the same direction, the study is on solid ground. If they do not, fix the mismatch before you collect anything.
Reporting and Interpreting Your Results
A good correlational result should be easy to read in one sentence. Name the variables, give the coefficient, and say what the pattern means in plain language. If you have a p-value or confidence interval, include it too.
A simple reporting template
You can adapt this format:
“[Variable 1] and [Variable 2] were [positively / negatively / not] correlated, r = [value], indicating that [plain-language interpretation].”
If your paper or report includes more detail, add the sample size and the significance result in the same sentence or the next one. For example, you might say that study time and exam score showed a positive relationship in the sample and that the result met your chosen significance threshold. Keep the wording cautious and direct.
A scatterplot helps readers judge the relationship for themselves. If the points curve, split into groups, or bunch around one end, don't force a simple straight-line story onto them. A fitted line can be useful, but it should support the data, not flatten it into something simpler than it really is.
Write what you found, not what you wish the result meant.
Weak reporting usually sounds vague. “There was a strong relationship” tells the reader almost nothing. Strong reporting names the variables, gives the actual statistic, and explains the meaning without turning association into causation.
Common Questions and Final Checklist
Before you launch the study, run through a short checklist. If even one item is missing, the result may be harder to trust or harder to explain.
Pre-launch checklist
- Variables defined: Each concept has a clear, measurable form.
- Design chosen: Observation, survey, or archival data fits the question.
- Test selected: Pearson, Spearman, or point-biserial matches the data.
- Sample planned: You know who is included and why.
- Analysis plan written: Your decisions are set before you look for patterns.
The questions people ask next are usually predictable. “How big does a correlation need to be?” There's no universal cutoff. A small relationship can still matter if the context is important, while a larger one may be less useful if it doesn't change decisions.
“Does zero correlation mean no relationship?” Not always. It may mean no straight-line relationship, or it may mean the relationship is hidden by subgroups, outliers, or a curve. That's why the scatterplot matters.
“What if the data aren't normal?” That's when Spearman's rank correlation is often a better starting point than Pearson's r. “When should I move beyond correlation?” If you need to model several predictors, compare groups, or test cause more directly, a regression setup or a true experiment may be the next step.
If you want a quick refresher before submitting your paper, the FAQ-style guide at 1chat FAQ can help you check your wording and tighten your interpretation.
The safest habit is simple. State the pattern, name the limits, and resist the urge to say more than your data can support.
If you're about to write a class paper, an internal memo, or a first research proposal, use this guide as your final pre-check. Open your variables, choose the right test, and draft your interpretation before you look at the result again. If you want a writing and research workspace that makes that process easier, try 1chat at 1chat.com.