You're in a meeting, a class, or halfway through a report. Someone puts a chart on the screen and starts talking as if the meaning is obvious. A line slopes up, a few bars look taller than the others, and everyone else seems to nod. You're still trying to figure out what the axes mean.
That feeling is common. Charts can look simple while hiding a lot of decisions about what to show, what to leave out, and how to frame the story. The good news is that reading them well isn't a talent you either have or don't have. It's a skill, and like most skills, it gets easier when you use a repeatable process.
One of the most useful findings in graph interpretation is that a structured review method, title → axes → labels → legend → data, can improve accuracy by 35% compared with glancing at the visual, according to Wake Forest University's guide to interpreting data visualizations. That matters whether you're checking a class assignment, reviewing a dashboard, or comparing business results.
Strong chart reading also connects to better decision-making. If you work with reports, dashboards, or planning documents, a practical resource like this guide to resilient data strategies can help you think beyond the chart itself and into the systems behind it. And if you're using AI tools to summarize information, platforms like 1chat make it easier to review documents and ask follow-up questions while you build your own judgment.
Introduction
Difficulty with charts doesn't stem from an inability to understand numbers. It arises because charts compress a lot of information into a small space. A single visual can contain categories, time periods, units, trends, comparisons, and design choices all at once.
That's why it helps to slow down. A chart is less like a photograph and more like a sentence written in visual form. If you rush, you miss the grammar.
Why charts feel harder than they look
A chart asks you to do several jobs at once:
- Decode the format so you know whether you're looking at change over time, category comparisons, or relationships between variables.
- Read the labels so you know what the numbers represent.
- Notice the framing so you can tell whether the creator is showing the full picture or only the most persuasive slice of it.
People often jump straight to the most dramatic shape. They see a sharp rise, a sudden dip, or a giant-looking bar and assume they already understand the message. That's where mistakes begin.
A chart should never get your trust just because it looks polished. It earns trust when its labels, scale, and context hold up under inspection.
Confidence comes from method, not speed
If you've ever said, “I'm just not a charts person,” try replacing that thought with a better one: “I need a checklist.” That shift matters. You don't need to interpret everything instantly. You need a process that helps you avoid common errors.
Once you know how to read charts and graphs in a steady order, the intimidation fades. You stop reacting to the picture and start examining the evidence.
The Universal Framework for Reading Any Chart
A useful chart-reading habit works across almost every format. Whether you're looking at a sales dashboard, a classroom worksheet, or a market report, the same sequence helps.
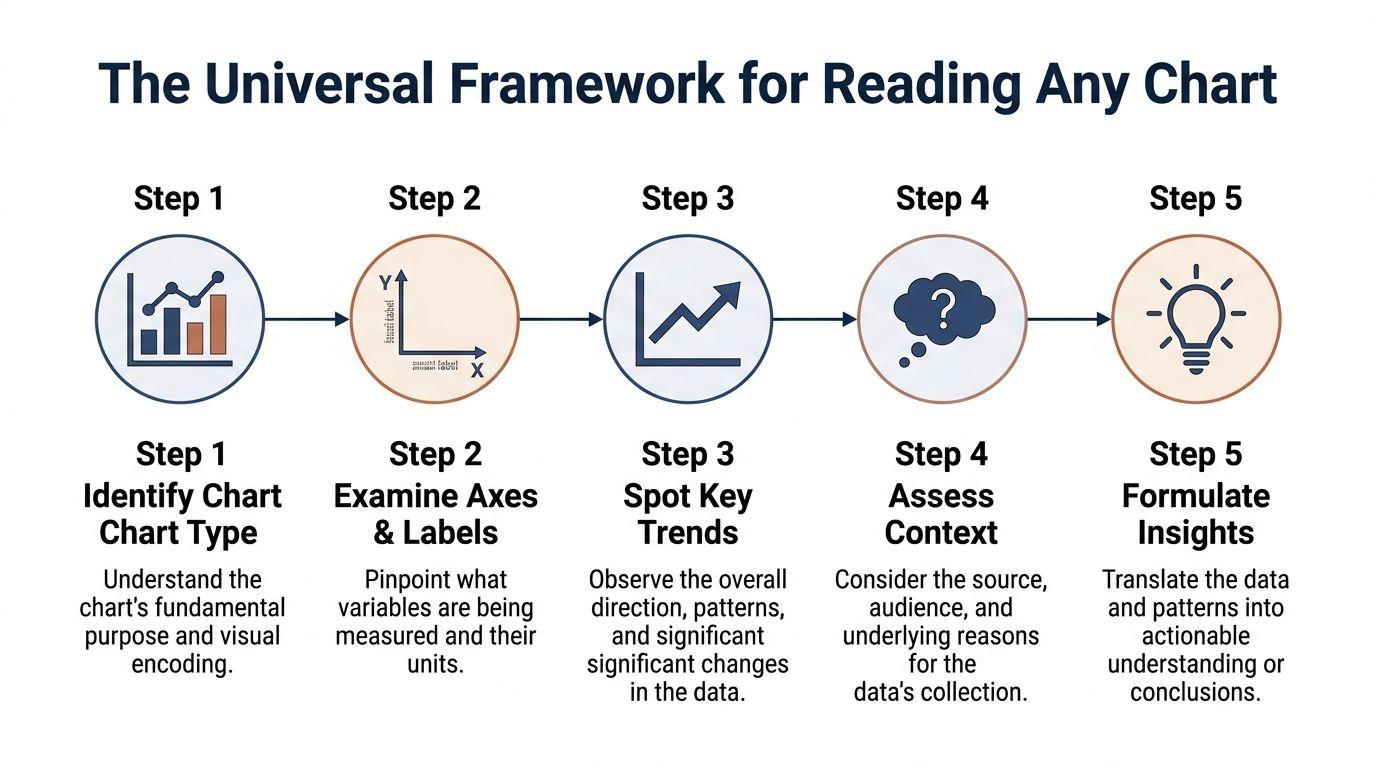
Start with the title and legend
The title tells you what question the chart is trying to answer. Don't skip it. A chart about “monthly revenue” is different from a chart about “year-over-year revenue growth,” even if the lines look similar.
The legend matters when the chart includes multiple lines, colors, symbols, or groups. If you ignore the legend, you may compare the wrong things.
Ask yourself:
- What topic is this chart about?
- Who or what is being measured?
- Are there different groups shown by color or pattern?
Read the axes before the shapes
The x-axis usually shows the independent variable, which is the thing being changed or organized, such as time, category, or treatment. The y-axis usually shows the dependent variable, which is what gets measured.
This sounds technical, but the practical question is simple: What is being compared against what?
If the x-axis shows months and the y-axis shows units sold, you're looking at change over time. If the x-axis shows product categories and the y-axis shows returns, you're comparing distinct groups.
Check the scale and units carefully
Charts can mislead many readers, even when numerically correct, if their scale exaggerates small differences.
According to Statistics Canada's guidance on using graphs, a graph is visually accurate only when its visual proportions match the data. If one value is 30 and another is 15, the larger one should appear exactly twice as large. The same guidance warns that narrowing the scale, such as showing 14 to 16 instead of a wider range, can make small changes look much bigger than they are.
Practical rule: Check where the y-axis begins. A shortened axis can turn a modest difference into a dramatic-looking story.
Also look for units. Are you seeing dollars, percentages, averages, counts, or rates? Two charts can use the same shape and mean very different things.
Identify the main pattern
Only after the title, axes, and scale should you ask what the chart seems to say.
Look for the broad pattern first:
- Upward movement suggests growth or increase
- Downward movement suggests decline
- Flat sections suggest stability
- Repeated rises and falls may suggest seasonality or cycles
- Clusters or spread may matter more than any single point
Don't overread one dramatic moment before you've understood the overall direction.
Notice outliers and exceptions
Outliers are points that don't fit the general pattern. They can be mistakes, rare events, or important clues.
A mostly steady line with one sharp spike deserves a question mark. A scatter plot with one point far from the others might suggest a special case. A bar chart with one unusually high category may reflect a real difference, or it may reflect a category that was defined differently.
A good reader doesn't just ask, “What's the pattern?” A good reader also asks, “What breaks the pattern, and why?”
Decoding the Six Most Common Charts and Graphs
Not every chart is built to answer the same kind of question. If you know the job of each chart type, you'll read it faster and more accurately.
One of the most important distinctions is this: line graphs are best for showing trends over time, while bar graphs compare distinct quantities. The same source also notes that correct reading depends on knowing which variable is on the x-axis and which is on the y-axis.
Bar charts and line graphs
Bar charts compare categories. Think of them as a lineup of separate buckets. Each bar stands for a different group, and the height represents the amount.
Use a bar chart when the question sounds like this: Which department had the most support tickets? Which product sold more units? Which city had the highest average rent?
Line graphs track movement across an ordered sequence, often time. They work well when the key question is about direction, trend, or turning points.
Use a line graph when the question sounds like this: How did traffic change across the year? Did attendance rise after the new schedule? When did the decline begin?
Pie charts and scatter plots
Pie charts show parts of a whole. They answer composition questions. What share of the budget went to payroll? How much of total survey response fell into each category?
They're easiest to read when there are only a few slices. If there are too many categories, the chart becomes harder to compare.
Scatter plots show relationships between two numerical variables. Each dot represents one observation. If the dots rise together, that suggests a positive relationship. If they scatter with no pattern, the relationship may be weak or unclear.
If you want a practical companion on when and why scatter plots work, this effective data visualization guide gives useful examples.
Histograms and box plots
Histograms group numerical data into ranges, often called bins. They show distribution. Instead of asking which category is biggest, a histogram asks how values are spread out.
That makes histograms useful for questions like: Are most response times clustered in a narrow range? Are test scores concentrated in the middle or spread out widely?
Box plots summarize distribution in a compact way. They help you compare spread, center, and unusual values across groups. Many readers find them less intuitive at first because they don't show raw values directly. But they're useful when comparing variation across several sets of data.
A quick cheat sheet
| Chart Type | Primary Use Case | Example Question it Answers |
| Bar chart | Compare distinct categories | Which product category sold the most? |
| Line graph | Show change or trend over time | How did weekly signups change across the semester? |
| Pie chart | Show parts of a whole | What portion of expenses came from each category? |
| Scatter plot | Show relationship between two variables | Do study hours and test scores appear related? |
| Histogram | Show distribution across ranges | Where do most delivery times fall? |
| Box plot | Compare spread and outliers across groups | Which class section has the widest score range? |
For readers who review charts often, it can help to save your own short reference notes, especially if you use tools, dashboards, or reports regularly. If you work with AI summaries and research workflows, the 1chat blog is one place to keep building those habits.
How to Spot Misleading Data and Hidden Bias
A chart can be easy to read and still be designed to push you toward a conclusion. That's the difference between literal reading and critical reading.
A useful warning comes from a source discussing chart interpretation and bias: many guides mention manipulated axes, but fewer explain how bias gets built in through selective timeframes or cherry-picked data. It also reports that a 2025 Pew Research study found 68% of adults can't identify whether a chart's source is politically or commercially biased in this context, as noted in Querio's discussion of how to interpret charts and graphs.
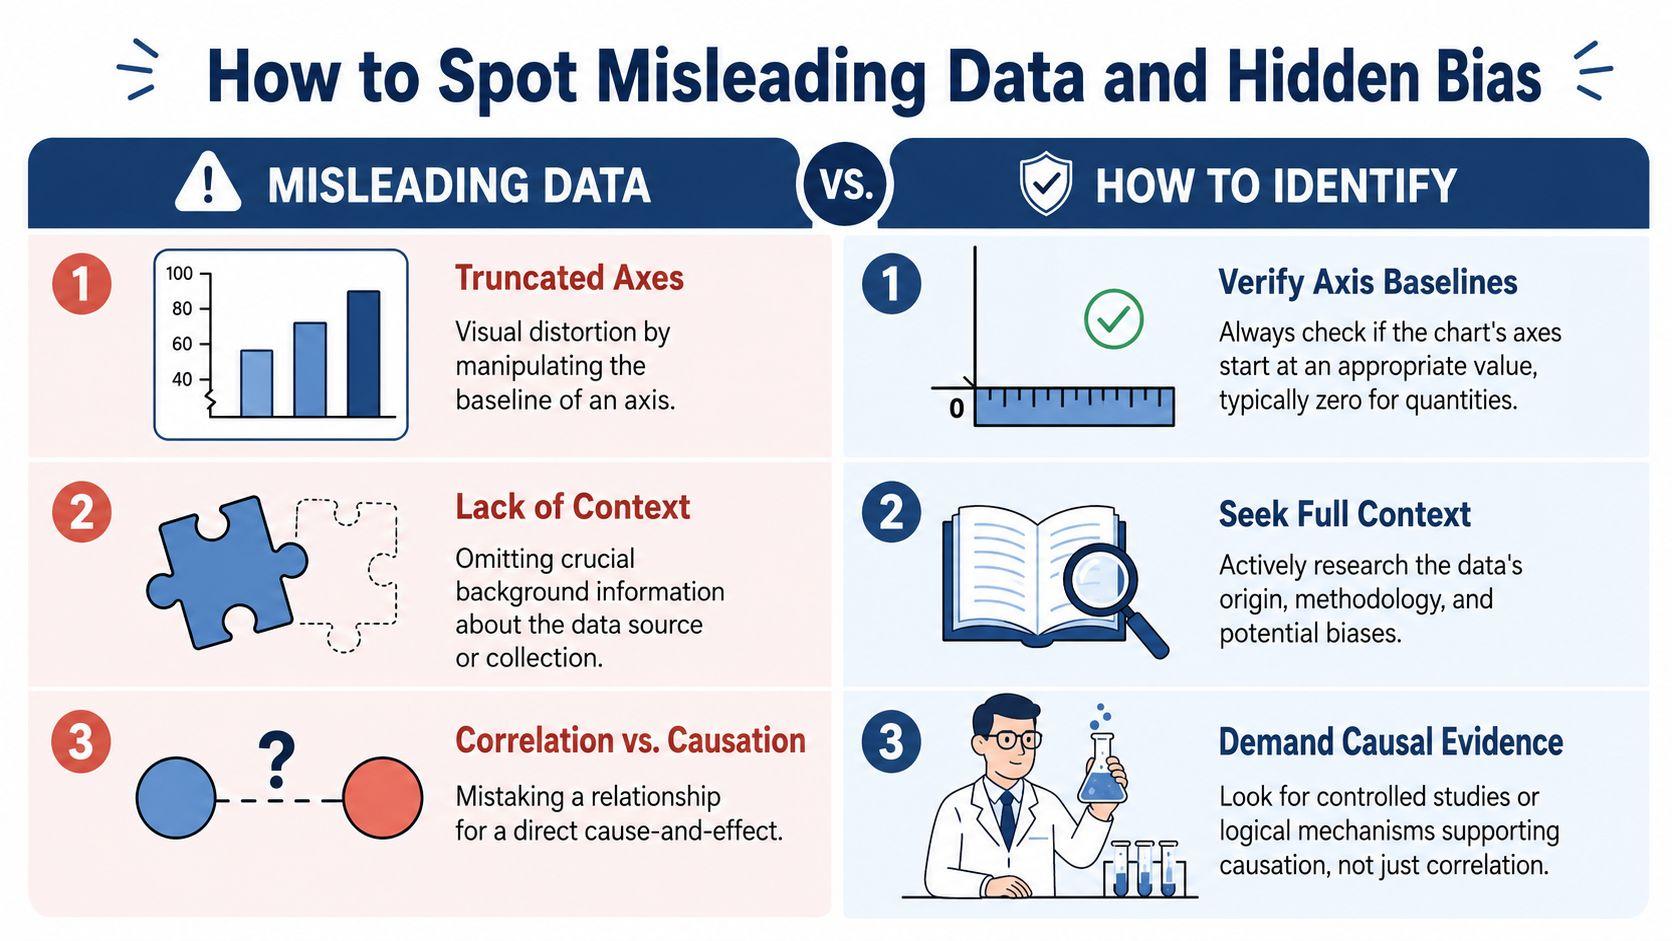
Watch for framing tricks
The most familiar trick is the truncated axis. Bars may look wildly different when the baseline starts far above zero. But that's only one tactic.
Bias also appears when creators choose a convenient date range. A line chart can make performance look impressive if it begins at a low point and ends at a temporary peak. The same data may look much less dramatic over a longer period.
Other warning signs include:
- Cherry-picked categories that leave out inconvenient comparisons
- Dual axes that place two unrelated scales side by side in a way that makes lines appear to move together
- Missing definitions that leave terms vague
- No source or method details so you can't tell where the numbers came from
Ask who made the chart and why
Every chart has a creator. That creator had a reason for making it.
A business may want to highlight growth. A campaign may want to show urgency. A student may unintentionally design a chart that supports their hypothesis because they're already attached to the conclusion.
Don't just ask whether the chart is clear. Ask whether the chart is trying to persuade you.
That question doesn't mean every chart is dishonest. It means every chart is selective. Someone chose the timeframe, the labels, the categories, and the visual emphasis.
Separate correlation from causation
One of the most common interpretation mistakes is seeing two variables move together and assuming one caused the other. A scatter plot can show association, not proof.
If advertising spend rose during the same months sales rose, that doesn't automatically prove the ads caused the increase. Seasonality, pricing changes, product launches, or outside events may also matter.
A skeptical reader asks:
- What's missing from this chart?
- What alternative explanation could fit the same pattern?
- What would I need to see before accepting a causal claim?
Those questions protect you in classrooms, meetings, and online debates alike.
Applying Chart Insights in School and Business
Reading charts matters most when it changes what you do next. The skill becomes real when you use it to answer a question, make a decision, or challenge a weak conclusion.

A student using a scatter plot
A high school student is working on a project about study habits. The class collected two pieces of data from volunteers: study hours and test scores. The chart is a scatter plot.
The student doesn't rush to say, “More studying causes better scores.” Instead, they look for the general pattern and then notice one point far from the others. One student studied a lot but scored lower than expected.
That outlier leads to a better discussion. Maybe that student was sick on test day. Maybe study time alone doesn't capture sleep, stress, or subject difficulty. The chart becomes a tool for asking stronger questions, not just delivering a neat answer.
A small business owner reading a line chart
A small shop owner reviews a line chart of monthly sales. The line rises in some months, dips in others, and repeats a familiar seasonal pattern.
Instead of reacting only to the latest dip, the owner compares the current month to the same period in the previous cycle and notices that the slowdown may be seasonal rather than alarming. That changes the staffing plan for the next quarter. It also shapes inventory choices and marketing timing.
If you run a small company and want more practical support on turning raw information into better choices, Menza's data analysis guide is a useful companion read. For teams or students who gather reports and compare findings across documents, 1chat research tools can help organize questions before decisions get made.
The real payoff
In both situations, the person reading the chart does three things well:
- They slow down long enough to understand what the visual measures.
- They resist easy conclusions when the evidence is incomplete.
- They turn patterns into action instead of stopping at description.
That's what practical data literacy looks like.
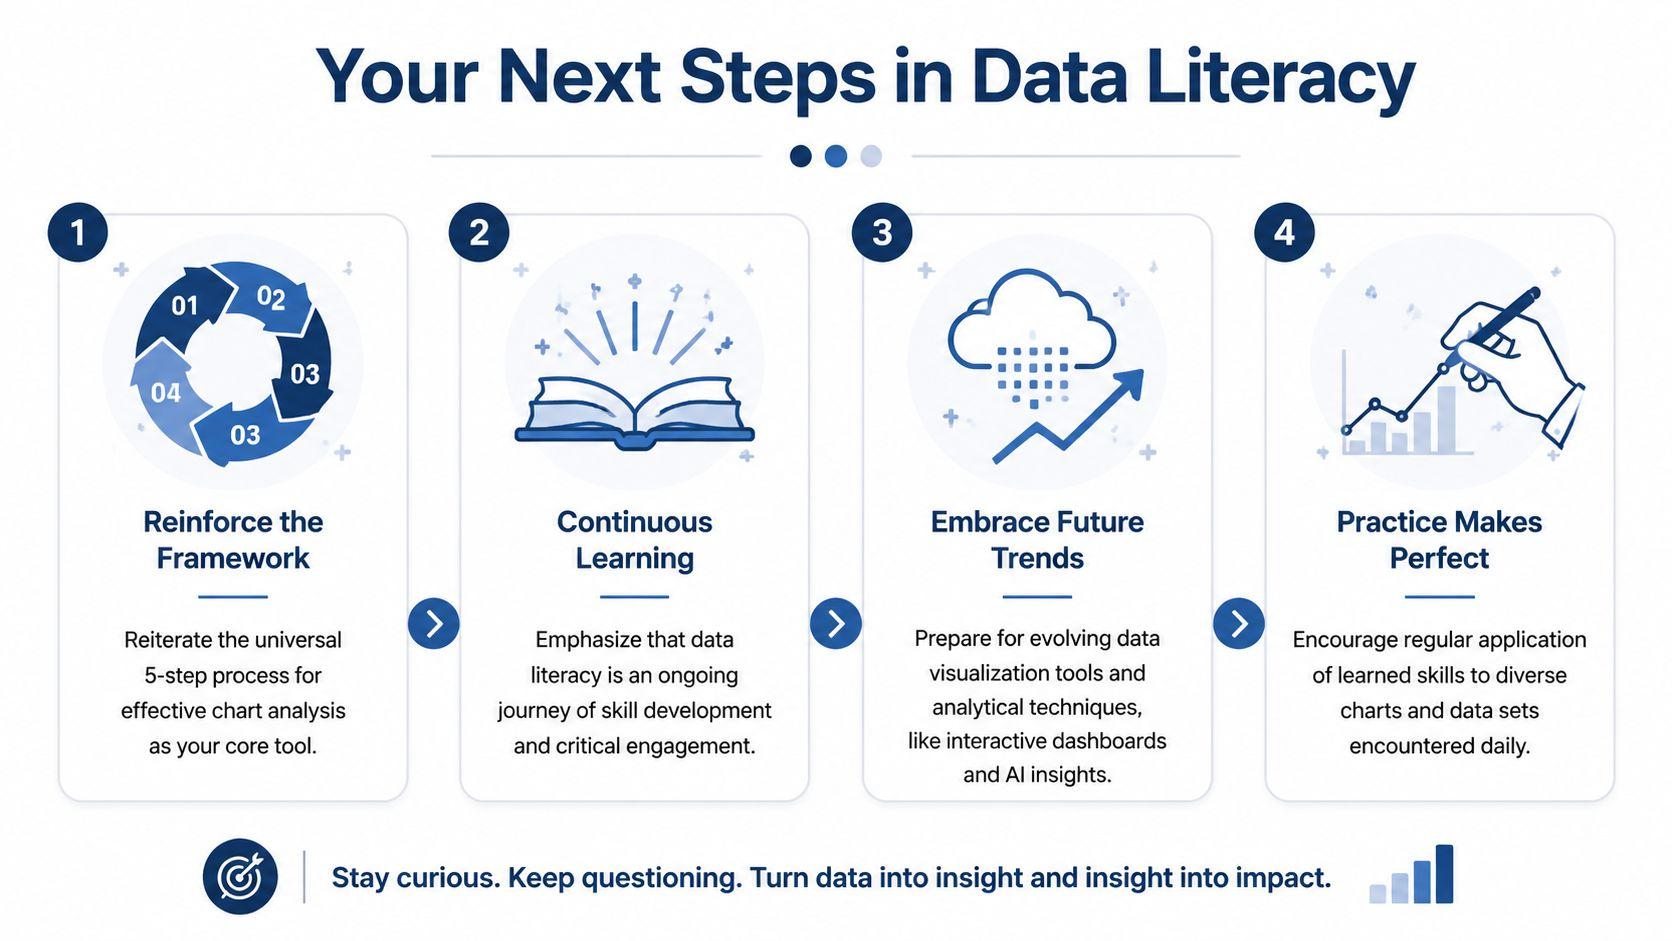
Your Next Steps in Data Literacy
The best way to improve is simple. Keep using the same reading habits until they feel natural. Start with the title. Read the axes. Check the scale. Find the pattern. Question the exceptions. Then ask whether the chart deserves your trust.
Why AI makes this skill more important
Modern chart reading now includes a new question: did a real dataset produce this visual in the first place?
A 2025 MIT study found that 42% of AI-generated line graphs contained subtle trend distortions that untrained readers didn't notice, according to this discussion of AI-generated chart risks. That means the old habit of checking labels and axes isn't enough on its own.
When a chart comes from an AI tool, ask:
- Is the underlying dataset real?
- Can I inspect the source data?
- Did the tool summarize accurately, or did it invent a cleaner story than the data supports?
Build the habit of verification
The future of how to read charts and graphs isn't just about better visual decoding. It's about combining visual reading with source verification, bias detection, and common sense.
You don't need to become a statistician to do this well. You need patience, a checklist, and the confidence to ask one more question than the average reader asks.
If you want a privacy-first AI workspace for document analysis, writing help, and research support, you can explore 1chat.