From planning a business strategy to organizing a family vacation or outlining a school essay, visualizing information is key to clarity and effective execution. Mind mapping images provide a powerful framework for this, transforming complex ideas into structured, easy-to-understand diagrams. They help you see connections, organize thoughts, and break down large projects into manageable steps. For students, they can be a game-changer for study and writing. For small businesses, they streamline project management and team brainstorming.
This guide moves beyond theory to provide a curated gallery of actionable mind mapping images. We will dissect ten distinct styles, from classic radial maps to specialized fishbone diagrams. You won't just see examples; you'll get a detailed breakdown of how and why each one works.
For every mind map style, you will find:
- Strategic Analysis: Unpacking the core purpose and ideal use case.
- Creation Tips: Practical advice for both manual and AI-assisted creation.
- Actionable Takeaways: Replicable methods you can apply immediately to your own projects.
By the end of this listicle, you'll have a clear visual library and the practical knowledge needed to select and create the perfect mind map for any task, whether for your team, your family, or your academic work.
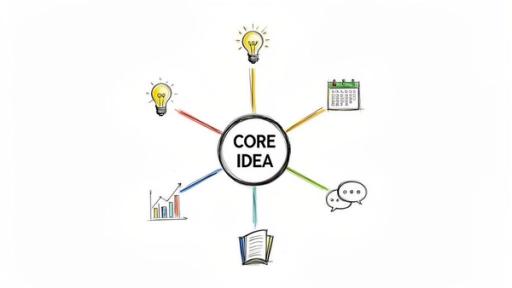
1. Radial/Circular Mind Maps
The radial mind map is the foundational structure in visual thinking, popularized by Tony Buzan. It begins with a single, central concept and radiates outward with branches representing primary themes and sub-themes. This hierarchical design mirrors the brain's associative thought process, making it an exceptionally intuitive format for organizing information and generating new ideas. Its strength lies in providing a clear, top-down view of a subject, from the core idea to the smallest detail.
Strategic Application & Use Cases
This classic format is a workhorse for various tasks across different groups. Because of its clarity, it is one of the most common types of mind mapping images found online and in textbooks.
- For Students: It’s perfect for organizing research for an essay or breaking down a complex scientific concept for exam revision. The visual links help solidify memory retention.
- For Businesses: Teams can use a radial map to brainstorm new product features or plan a quarterly content calendar, ensuring all ideas are connected back to the main objective.
- For Families: A circular map can help organize a family vacation, with the destination as the central idea and branches for budget, activities, packing lists, and schedules.
Actionable Creation Tips
To create an effective radial mind map, focus on simplicity and visual cues.
- Limit Main Branches: Stick to 5-7 main branches extending from your core idea. This prevents visual clutter and cognitive overload.
- Use Color Coding: Assign a unique color to each main branch and its sub-branches. This visually separates distinct themes, making the map easier to read at a glance.
- Incorporate Visuals: Add small icons or simple drawings next to keywords. These act as powerful memory aids, making your map more engaging and memorable.
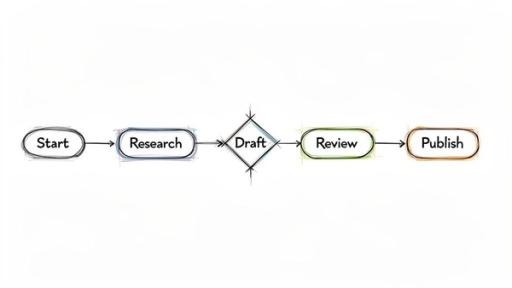
2. Flowchart/Linear Mind Maps
Moving from radial brainstorming to sequential logic, the flowchart or linear mind map organizes information based on process and order. Unlike the free-flowing associative structure of a radial map, this style uses a top-to-bottom or left-to-right progression to illustrate workflows, decision trees, and step-by-step procedures. Its power comes from visualizing a sequence of events, making it ideal for standardizing processes and identifying potential bottlenecks.
Strategic Application & Use Cases
This process-oriented format is essential for any group that needs to document, standardize, or troubleshoot a series of actions. The clarity of its directional flow makes these types of mind mapping images common in business and technical documentation.
- For Businesses: A small business can map out its entire customer journey, from initial contact to post-purchase follow-up, to find areas for improvement. It’s also used to create decision trees for customer service protocols, ensuring consistent responses.
- For Students: A linear map can outline the steps needed to complete a science experiment or code a simple program, ensuring no critical stage is missed.
- For Families: This format can be used to create a "morning routine" chart for kids or a step-by-step guide for a complex recipe, making instructions easy to follow.
Actionable Creation Tips
To build an effective flowchart, prioritize clarity and logical progression.
- Use Standard Shapes: Employ rectangles for process steps and diamond shapes for decision points (e.g., "Yes/No" questions). This visual shorthand is universally understood.
- Keep Text Concise: Limit the text inside each box to a short, action-oriented phrase. The goal is to show the flow, not to provide exhaustive detail in each step.
- Show Clear Direction: Use solid arrows to connect each step, leaving no ambiguity about the process direction. The path from start to finish should be unmistakable.
3. Organic/Free-Form Mind Maps
Breaking away from strict hierarchies, the organic mind map is a more artistic and fluid approach to visual thinking. It prioritizes creativity and intuitive connections, allowing branches to flow naturally without rigid rules or straight lines. Popularized by design thinking practitioners and sketchnote experts, this style uses curved lines, varied shapes, and a non-linear format that encourages spontaneous idea generation. Its beauty lies in its adaptability, reflecting the often messy and interconnected nature of creative thought.
Strategic Application & Use Cases
This free-flowing format excels in situations where creativity is more important than structure. Its unstructured nature makes it a fantastic tool for personal exploration and early-stage ideation, producing unique mind mapping images that capture a snapshot of a brainstorm.
- For Businesses: Marketing teams can use an organic map for a brand identity brainstorming session, where abstract concepts and feelings are just as important as concrete ideas.
- For Students: It’s ideal for conceptualizing an art project or exploring themes in a literature class, allowing ideas to connect and evolve without a predetermined outline.
- For Individuals: Many use this style for personal goal-setting or life planning, mapping out aspirations, values, and potential paths in a visually inspiring way.
Actionable Creation Tips
To create a successful organic mind map, embrace spontaneity and visual expression.
- Let Ideas Flow: Start drawing without a pre-planned structure. Allow one idea to lead naturally to the next, and don't worry about where it "fits."
- Vary Your Lines: Use a mix of thick and thin lines, dotted lines, and arrows to show different types of connections. This adds visual interest and clarifies relationships.
- Integrate Doodles and Sketches: Add small, hand-drawn elements next to your keywords. A quick sketch of a lightbulb for "idea" or a globe for "global" makes the map more personal and memorable.
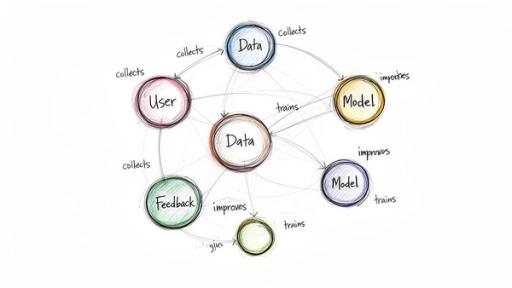
4. Concept Map/Network Style
Where traditional mind maps focus on a single central idea, the concept map visualizes the complex relationships between multiple, often equally important, concepts. Popularized by Joseph Novak, this network-style diagram uses labeled links to show how different ideas connect and influence one another. It excels at representing non-linear systems, making it a powerful tool for understanding intricate subjects where hierarchy is less important than interconnection.
Strategic Application & Use Cases
This format is ideal for mapping knowledge and systems where relationships are the key story. These types of mind mapping images are common in academic and technical fields.
- For Businesses: Tech teams can document system architecture, showing how different microservices interact. A support team might map a knowledge base, connecting customer problems to solutions and related articles.
- For Students: It is perfect for academic research, allowing a student to map out connections between different theories, studies, and authors. Learning how to organize research notes with this method can reveal deeper insights.
- For Individuals: Anyone can use a concept map to understand personal finance, linking income sources, expenses, savings goals, and investment vehicles to see how they affect one another.
Actionable Creation Tips
A successful concept map depends on clarity and logical connections.
- Label All Links: Clearly describe the relationship on the line connecting two concepts (e.g., "causes," "leads to," "requires"). This context is what gives the map its meaning.
- Use Consistent Shapes: Assign specific shapes to different types of information. For instance, use ovals for concepts and rectangles for examples to create a clear visual language.
- Start Broad, Then Refine: Begin by placing your main concepts on the canvas. Connect them first, then progressively add more detailed, subordinate ideas to build out the network.
5. Fishbone/Ishikawa Diagram Style
Popularized by quality management pioneer Kaoru Ishikawa, the fishbone diagram is a structured cause-and-effect tool. It positions a central problem statement as the "spine" of a fish skeleton, with main causal categories branching off like "ribs." This format is designed specifically for root cause analysis, guiding users to methodically explore all potential factors contributing to an issue rather than just jumping to the most obvious symptom.
Strategic Application & Use Cases
The fishbone's strength is its structured approach to problem-solving, making it an essential type of mind mapping images for analytical tasks. Its visual organization prevents teams from overlooking entire categories of potential causes.
- For Businesses: A small team can investigate a sudden spike in customer complaints, organizing potential causes under categories like People, Process, Technology, and Policy to identify the true source.
- For Students: A student group can analyze why a major class project failed, using the diagram to explore issues related to planning, resources, communication, and individual responsibilities.
- For Families: It can be used to troubleshoot a recurring household problem, like consistently high utility bills, by examining factors such as appliances, habits, insulation, and external influences.
Actionable Creation Tips
To build an effective fishbone diagram, focus on systematic inquiry and collaborative input.
- Define Clear Categories: Before brainstorming, establish clear, mutually exclusive main categories (e.g., the 6 M's: Manpower, Method, Machine, Material, Measurement, Mother Nature).
- Ask 'Why?' Repeatedly: For each potential cause you list, drill down by asking "Why did that happen?" at least five times. This "5 Whys" technique helps you move from symptoms to root causes.
- Involve Cross-Functional Members: Bring in people from different roles who interact with the problem. Their diverse perspectives will reveal causes that a single person or team might miss.
6. Tree/Hierarchical Mind Maps
The tree or hierarchical mind map organizes information in a top-down, linear structure, similar to a family tree or an organizational chart. It starts with a main topic at the top and branches downwards into parent-child relationships. This format excels at showing clear categorization and a systematic breakdown of information, making it ideal for subjects that require a strict order and logical flow. Its strength is in presenting complex hierarchies in a clean, easy-to-follow manner.
Strategic Application & Use Cases
This structured format is perfect for planning and documentation where order is critical. The clear, descending flow makes these mind mapping images a go-to for showing relationships within a system.
- For Businesses: It is perfectly suited for creating an organizational chart, detailing a product’s feature taxonomy, or mapping out website navigation.
- For Students: This map is an excellent tool for breaking down the chapters of a book or structuring a research paper. For more details, you can learn how to write a research paper outline with this method.
- For Families: It can be used to create a family tree, document household responsibilities by category (e.g., Cleaning > Bathrooms > Sink), or plan a project with sequential steps.
Actionable Creation Tips
To build an effective tree map, the key is maintaining logical consistency and visual balance.
- Limit Vertical Depth: Keep the hierarchy to a maximum of 5-6 levels. Going deeper can make the map difficult to read and visually overwhelming.
- Use Consistent Naming: Apply a standard naming convention for your nodes (e.g., all main categories are nouns, all sub-tasks start with verbs) for clarity.
- Balance the Branches: Try to distribute your sub-topics evenly across the main branches. This prevents a lopsided tree and makes the information appear more organized.
7. Scatter/Node-and-Link Style
The scatter or node-and-link style is a highly flexible visualization method where ideas are represented as scattered nodes (circles or shapes) connected by lines. Unlike hierarchical maps, this format imposes no rigid structure, allowing for complete freedom in placing and linking concepts. It is exceptionally useful for exploring complex systems and capturing emergent relationships as they are discovered, making it a favorite in network analysis and academic research.
Strategic Application & Use Cases
This freeform approach is ideal for situations where relationships are more important than hierarchy. Its flexibility allows it to model intricate networks, making these particular mind mapping images a powerful tool for deep analysis.
- For Businesses: A marketing team could use a node-and-link map for competitive analysis, plotting competitors as nodes and connecting them based on shared target audiences, feature overlap, or pricing strategies.
- For Researchers: Academics can organize a literature review by representing each study as a node, linking them based on cited works, conflicting findings, or supporting arguments to visualize the state of current research.
- For Individuals: It can be used for social network mapping, helping to visualize personal and professional connections and identify key influencers or gaps within a community.
Actionable Creation Tips
To create a clear and insightful node-and-link map, focus on visual differentiation and clarity.
- Vary Node Size: Use the size of each node to represent its importance or influence. Larger nodes can signify core concepts or major players, drawing immediate attention.
- Color-Code Categories: Assign colors to different categories or themes. For example, in market research, you might use one color for direct competitors and another for indirect ones.
- Use Different Line Styles: Employ solid, dashed, or colored lines to signify different types of relationships. A solid line could mean a strong direct connection, while a dashed line indicates a weaker or indirect link.
8. Timeline/Chronological Mind Maps
A timeline mind map organizes information linearly according to time, showing how ideas, events, or processes unfold in sequence. This structure emphasizes temporal relationships and progression, moving from a starting point to an endpoint. Unlike radial maps that explore a concept's components, this format focuses on evolution and causality, making it perfect for understanding historical flows or planning project phases.
Strategic Application & Use Cases
This linear format is critical for any task where sequence is the primary organizing principle. Its straightforward, progressive nature makes it one of the most effective mind mapping images for planning and analysis.
- For Businesses: Project managers use it to visualize a product roadmap, plotting milestones from initial concept to launch. It provides a clear overview of deadlines and dependencies.
- For Students: It’s an excellent tool for outlining historical essays or tracking the plot of a novel, ensuring all events are presented in the correct chronological order.
- For Personal Projects: You can map out personal goals for the year, breaking down large ambitions into smaller, time-bound steps to track your progress.
Actionable Creation Tips
To build a clear and effective timeline mind map, focus on progression and clarity.
- Establish a Clear Direction: Lay out your timeline horizontally (left to right) or vertically (top to bottom) to represent the flow of time.
- Use Visual Milestones: Mark significant dates or events with larger nodes, different colors, or icons. This helps key moments stand out.
- Add Parallel Tracks: If multiple processes are happening at the same time, create separate parallel lines to track them concurrently, showing their interrelation over time.
9. Cluster/Bubble Mind Maps
Popularized by information visualization designers and UX practitioners, the cluster or bubble mind map uses overlapping or closely grouped circles to represent ideas. Unlike the rigid hierarchy of a radial map, this style emphasizes relationships and groupings through proximity and size. Varying the size of each bubble can indicate the importance or scale of a concept, while overlapping bubbles show a direct intersection between two ideas. This format is great for exploring interconnected themes without being confined to a top-down structure.
Strategic Application & Use Cases
This format’s strength is in visualizing connections and groupings, making it one of the more flexible types of mind mapping images for conceptual work. It helps identify natural clusters within a sea of information.
- For Businesses: It’s excellent for mapping team skills and identifying resource gaps or for visualizing market segments to see where customer profiles overlap.
- For Students: A student could use a bubble map to categorize content themes for a literature review, showing how different novels share common motifs.
- For Families: When planning a multi-generational trip, a cluster map can group activities by interest (e.g., "Kids," "Grandparents," "Everyone"), with overlaps showing activities multiple groups would enjoy.
Actionable Creation Tips
To create a clear and insightful cluster map, focus on visual relationships.
- Vary Bubble Size: Make the size of each bubble proportional to its importance or scale. This gives an immediate visual cue about which ideas are most significant.
- Use Transparent Colors: Apply semi-transparent colors to your bubbles. This allows you to see the text and relationships clearly where circles overlap.
- Group Logically: Keep related bubbles close together to form distinct visual clusters, and use empty space to separate unrelated groups.
10. Hybrid/Multi-Format Mind Maps
The hybrid mind map is an advanced structure that combines multiple styles, like radial, timeline, and flowchart elements, into a single visual. This flexible approach allows you to adapt the format to different parts of your subject matter, making it ideal for representing complex, multi-faceted topics. For instance, a central radial map could branch into a linear timeline for one theme and a flowchart for another, providing the best visual tool for each specific type of information.
 to each main branch to ensure functional clarity.
- Maintain Visual Consistency: Use a consistent color palette and typography throughout the different sections. This helps unify the diverse formats into a cohesive and professional-looking document.
- Create a Legend: Include a small key or legend that explains what each format or symbol represents. This is critical for helping new viewers understand how to navigate the map's different parts.
10 Mind Map Image Styles Comparison
| Style | 🔄 Implementation Complexity | ⚡ Resource Requirements | 📊 Expected Outcomes | 💡 Ideal Use Cases | ⭐ Key Advantages |
| Radial / Circular Mind Maps | Moderate — intuitive branching, easy to expand | Low — paper or basic mind‑map apps | Broad idea coverage; strong brainstorming results | Brainstorming, project planning, research organization | Intuitive expansion; visual memory aid; good for collaboration |
| Flowchart / Linear Mind Maps | Moderate–High — formal flow and decision logic | Medium — diagram tools (Visio/Lucidchart) | Clear process documentation and decision clarity | Workflows, decision trees, content creation pipelines | Clear sequencing; easy to spot bottlenecks |
| Organic / Free‑Form Mind Maps | Low–Moderate — loose rules, freehand creativity | Low — sketching tools or paper | High divergent ideation and creative insight | Creative brainstorming, personal planning, ideation sessions | Encourages creativity; engaging and memorable visuals |
| Concept Map / Network Style | High — plan multi‑directional links and labels | Medium–High — mapping tools and time for accuracy | Deep understanding of relationships and dependencies | Knowledge bases, academic mapping, system architecture | Reveals complex interrelationships; identifies knowledge gaps |
| Fishbone / Ishikawa Diagram | Moderate — structured template focused on causes | Low–Medium — templates and cross‑team input | Systematic root‑cause identification | Quality improvement, root cause analysis, incident review | Structured cause breakdown; focused team problem‑solving |
| Tree / Hierarchical Mind Maps | Moderate — strict parent‑child modeling | Low–Medium — basic diagramming tools | Clear categorization and organized breakdowns | Org charts, taxonomies, educational outlines | Very clear hierarchy; easy to scan and navigate |
| Scatter / Node‑and‑Link Style | High — iterative layout, no imposed order | Medium–High — large canvas, visualization tools | Exploration of complex, non‑linear networks | Competitive analysis, social networks, research mapping | Highly flexible; surfaces emergent connections |
| Timeline / Chronological Mind Maps | Low–Moderate — linear sequencing by time | Low — timeline templates or simple tools | Clear temporal narrative and roadmap visualization | Project milestones, product roadmaps, historical analysis | Excellent temporal clarity; good for storytelling |
| Cluster / Bubble Mind Maps | Moderate — spatial grouping and sizing decisions | Medium — visual tools and careful layout | Clear groupings and emphasis on category importance | Content categorization, market segmentation, team skills | Visually appealing clusters; shows relative importance |
| Hybrid / Multi‑Format Mind Maps | Very High — combines multiple styles, design heavy | High — advanced tools, planning time, expertise | Comprehensive, tailored maps for complex topics | Enterprise strategy, multi‑disciplinary research, product ecosystems | Optimizes representation per section; handles extreme complexity |
Final Thoughts
Throughout this guide, we've explored the diverse and powerful world of mind mapping images. From the classic radial structure to the cause-and-effect clarity of a fishbone diagram, we’ve seen how these visual tools are far more than just spider diagrams. They are dynamic frameworks for thinking, planning, and communicating complex information with remarkable efficiency. The true value lies not just in recognizing these different styles, but in understanding which format best serves your specific goal.
The examples we've analyzed demonstrate a core principle: the structure of your mind map should mirror the structure of your thoughts. A linear process demands a flowchart, while a brainstorming session thrives in a free-form, organic layout. By matching the tool to the task, you move from simply recording ideas to actively shaping and clarifying them.
Your Path to Mastering Mind Maps
The key takeaway is that creating effective mind mapping images is a skill that blends strategic thinking with creative expression. It's about making conscious choices. Whether you are a student organizing research for an essay, a small business owner outlining a marketing campaign, or a family planning a vacation, the right visual format can bring order to chaos.
Here are your actionable next steps:
- Start with Purpose: Before you draw a single line, ask yourself: What am I trying to achieve? Am I brainstorming, planning a sequence, or analyzing a problem? Your answer will point you toward the ideal mind map style.
- Experiment with Tools: Don't stick to just one method. Try hand-drawing a quick organic map for a creative session. Use a simple digital tool for a clean, hierarchical tree map. Experiment with AI prompts, like the ones provided, to generate visually striking and conceptually sound starting points for more complex projects.
- Focus on Clarity, Not Perfection: The goal is communication and understanding, not creating a museum-worthy piece of art. A messy-but-functional mind map that helps you solve a problem is far more valuable than a beautiful but confusing one. Use color, icons, and spacing to guide the eye and create a clear visual hierarchy.
Strategic Insight: The most powerful mind maps are iterative. They grow and change as your understanding of the subject deepens. Treat your first draft as just that-a starting point. Revisit and refine it, combining elements from different styles if needed to build a hybrid map that perfectly fits your unique project.
Ultimately, mastering the art of creating mind mapping images gives you a significant advantage. It allows you to break down overwhelming tasks, uncover hidden connections between ideas, and present your thoughts to others with compelling clarity. For students, this means better grades and less stress. For businesses, it translates to better strategy and more efficient teamwork. For families, it creates a fun and collaborative way to organize shared goals.
The journey from a blank page to a finished mind map is a journey of discovery. Start with a single idea, choose your structure, and watch as your thoughts take shape in a clear, organized, and insightful new way.