Think of your research methodology as a detailed recipe for a meal or the strategic blueprint for a building. It’s the game plan that takes you from a curious question to a credible answer, and it's the absolute backbone of any serious project.
What Is Research Methodology and Why It Matters
At its core, a research methodology is simply the "how" of your study. It's the specific, systematic process you'll follow to make sure your findings are both valid and reliable. Without a solid methodology, your research is like trying to build a house without a blueprint—you might end up with something, but it probably won’t be sturdy or fit for purpose.
Whether you're a student working on a thesis, a family researching local schools, or a small business trying to understand its customers, a well-thought-out plan is everything. It gives your work structure, focus, and most importantly, credibility.
A strong methodology turns your personal curiosity into a structured investigation that others can understand, evaluate, and trust. It’s the difference between a random guess and an educated conclusion.
The Two Primary Research Approaches
To get started, it helps to understand the two main categories of research. The path you choose really depends on what you want to discover.
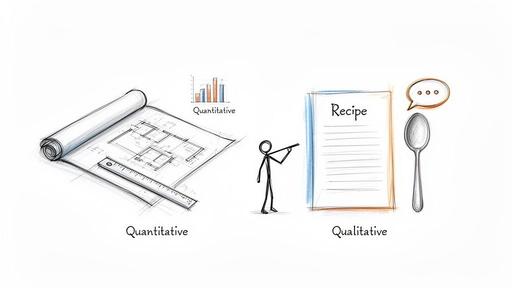
- Quantitative Research: This approach is all about numbers, statistics, and measurable data. Think charts, graphs, and spreadsheets. It's perfect for testing a hypothesis, measuring trends, and finding patterns across a large group. If your question starts with "How many?" or "How often?", you're probably heading down a quantitative path.
- Qualitative Research: This approach dives into the world of non-numerical data—things like stories, opinions, and firsthand experiences. It uses methods like interviews and observations to get at the "why" behind the numbers, providing rich context and a human perspective.
To give you a clearer picture, here’s a quick side-by-side comparison.
Quantitative vs Qualitative Research at a Glance
| Aspect | Quantitative Research (Numbers-Focused) | Qualitative Research (Story-Focused) |
| Goal | To measure, test, and confirm hypotheses | To explore, understand, and interpret experiences |
| Data Type | Numbers, graphs, tables | Words, images, observations, stories |
| Sample Size | Large, to ensure statistical significance | Small, to allow for in-depth analysis |
| Common Questions | How many? How much? How often? | Why? How? What are your experiences? |
| Analysis | Statistical analysis, mathematical calculations | Thematic analysis, interpretation of text/narratives |
This table helps show that neither approach is inherently better—they just answer different kinds of questions.
Interestingly, the business world has long shown a preference for hard data. A recent report found that quantitative methods accounted for 70% of global market research turnover, while qualitative work made up just 14%. This shows how much value is placed on large-scale, measurable data, but a savvy researcher knows that the real magic often happens when you combine both.
Ultimately, your methodology is your trusted guide. It ensures every step you take, from gathering information to analyzing it, is deliberate and logical. Before you start designing your own project, it’s a great idea to see how others have structured their work. You can check out our guide on how to write a literature review to learn how to break down and learn from existing studies. Getting this foundation right is the key to a project that actually delivers reliable results.
Choosing Your Research Design: The Master Plan
If your methodology is the overall recipe, think of the research design as the actual cooking instructions. It’s the specific plan you'll follow, the structure that holds your whole project together and connects your core question to the answers you hope to find. Getting this part right is probably one of the most critical steps in your entire research journey.
It's all about matching the tool to the job. You wouldn't bring a thermometer to a foot race. If you want to know who runs the fastest, you set up a race—that's an experiment. If you just want to know what music people like, you ask them—that's a survey. Your question always points the way to the right design.
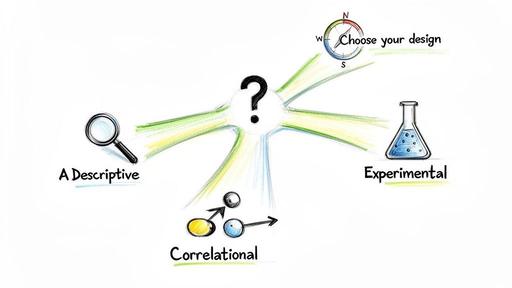
For anyone just starting out, there are three fundamental designs that form the bedrock of almost all research. Let's walk through them one by one.
Descriptive Research: The Snapshot
The most common and straightforward approach is descriptive research. Its only job is to describe what’s going on. It’s all about capturing a clear, accurate snapshot of a group or a situation as it exists right now. This design answers the "what is?" question.
Descriptive research doesn't try to explain why something is happening. It simply lays out the facts.
- For a Small Business: A local bakery owner might track how many croissants they sell each day for a month. The goal isn't to figure out why sales go up or down, but just to get a clear picture of their popularity.
- For a Student: A student could survey their classmates to find out the average amount of screen time they have per day. The study simply describes the current screen time habits of that specific group.
This kind of research is foundational. Sometimes, just having a clear description is an incredibly powerful insight that can lead to deeper questions later.
A great descriptive study gives you a solid baseline. It establishes the facts on the ground before you can even begin to ask more complicated questions like "why?" or "what if?"
Correlational Research: Finding Connections
Once you have a good description of what's happening, the natural next question is often about connections. Are different things related? That's where correlational research comes into play. This design measures two or more things (we call them variables) to see if a relationship exists between them.
Now, here's a crucial point every beginner must learn: correlation does not equal causation. Just because two things move together doesn't mean one is causing the other. For example, ice cream sales and the number of people who get sunburned both go up in the summer. One doesn't cause the other; the hot weather is the hidden factor influencing both.
Here’s how you might see this in action:
- For a Family: A family could track their teenager's daily hours of video gaming and their grades on weekly quizzes. They're looking for a correlation—does one tend to go up when the other goes down?
- For a Team: A manager might track the number of positive feedback comments a team receives and the number of tasks completed ahead of schedule. They're looking for a potential relationship between morale and efficiency.
Experimental Research: Testing for Cause and Effect
When you absolutely need to know if one thing causes another, you have to run an experiment. An experimental design is the gold standard for establishing a true cause-and-effect relationship. It’s built to answer the question, "If I change this one thing, what happens?"
In a basic experiment, you intentionally change one thing (the independent variable) to see how it impacts something else (the dependent variable), while doing your best to keep everything else the same. This usually means having a "control group" that doesn't get the change, which gives you a baseline for comparison.
- For a Small Business: An e-commerce site wants to test if a new "Buy Now" button color increases sales. They could show 50% of visitors the old blue button (the control group) and the other 50% a new green button (the experimental group). By comparing the sales from each group, they can see if the color change actually caused a difference.
- For a Student: To see if listening to classical music improves focus, a student could have one group of friends do a puzzle in silence and another group do the same puzzle while music plays. Comparing the completion times can show if the music had a real effect.
How to Collect Your Data: Methods and Tools
With your research design mapped out, it’s time for the exciting part: actually gathering the information. This is where your theoretical plan gets its hands dirty and meets the real world. The methods you use to collect data need to be a perfect match for your research question and the kind of insights you’re after—whether that’s hard numbers (quantitative) or rich stories (qualitative).
Think of yourself as a detective on a case. If you need to know how many people were at the scene of a crime, you’d count them. But if you want to understand why they were there and what they saw, you’d have to talk to them one by one. Each method uncovers a different type of clue.
Your Toolkit for Gathering Information
Let's walk through the most common methods. You don't need to be a seasoned academic to use them, and each one has its own unique power. Understanding what they do best will help you pick the right tool for your project.
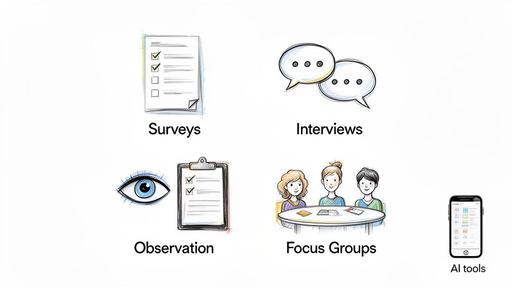
Surveys and Questionnaires
When you need to get answers from a lot of people without spending a ton of time, surveys are your best friend. They’re fantastic for collecting quantitative data because everyone answers the same set of questions, which makes it simple to spot trends and patterns across the group.
For example, a student could create a 10-question online survey to understand the study habits of their classmates. By asking about study hours, favorite subjects, and common resources, they can quickly get a big-picture view of the entire year group.
Interviews
An interview is essentially a focused conversation. This is your go-to method for digging deep into the "why" behind people's thoughts and actions. You can follow a strict script (structured) or allow the conversation to flow more naturally (semi-structured), letting you explore unexpected ideas as they come up.
Imagine a small business owner noticing that customers aren't using a new app. They could conduct one-on-one interviews with ten loyal customers to get their unfiltered, honest feedback and uncover the real reasons behind the low engagement.
Great interviews are less about checking off questions and more about genuine listening. Your goal is to understand someone's world from their perspective, uncovering insights you might never have thought to ask about.
Observations
Sometimes, the best way to learn is just to watch. Observation involves systematically watching and recording what people do in their natural environment. This is incredibly powerful because it reveals actual behavior, which can be very different from what people say they do.
A family wanting to research local parks could spend an afternoon simply observing which areas are most popular. By noting how many people use the playground versus the picnic tables, they can figure out which features the community truly values.
Focus Groups
A focus group is a guided discussion with a small handful of people (usually 6-10) about a particular topic. The magic here happens in the group dynamic—participants build on each other's ideas, sparking conversations and revealing a spectrum of opinions you wouldn't get in a one-on-one setting.
For instance, a team developing a new after-school program might hold a focus group with local parents. This would be a great way to get immediate reactions to their proposed activities and see if the concept resonates with its intended audience.
Choosing the Right Method and Tools
So, how do you choose? Always let your research question be your guide. If you need numbers to compare things, start with a survey. If you need personal stories to understand an experience, interviews are your answer.
Often, the most powerful insights come from mixing methods. You could start with a broad survey to identify a key trend, then follow up with a few in-depth interviews to hear the personal stories behind the statistics. This is how major studies are often done. The Ipsos Global Trends survey, for example, involved a staggering 48,541 interviews across 50 markets, combining different approaches to get both massive scale and deep understanding. You can see the full global study results on their site.
Don't feel like you have to do it all from scratch, either. Modern tools can give you a huge leg up. For example, an AI assistant like 1chat is a fantastic co-pilot for beginners. You can use it to brainstorm smart survey questions, draft a script for an interview, or figure out a simple way to organize your observation notes. It helps you stay organized and ensures the data you collect is high-quality right from the start.
Making Sense of Your Findings: An Introduction to Data Analysis
You’ve done the hard work of collecting your information. Now you’re sitting on a pile of raw material—survey responses, interview notes, or a log of your observations. This is where the real discovery begins. Data analysis is all about sifting through that material to spot patterns, uncover themes, and find the story your research is trying to tell.
Think of yourself as a detective who’s just wrapped up collecting clues. Your next job is to spread everything out on the table, look for connections, and piece together what really happened. The way you do this will depend entirely on what kind of clues you have: numbers (quantitative data) or words and stories (qualitative data).
Analyzing Your Quantitative Data
When you’re working with numbers, your first goal is to summarize them in a way that makes sense. You don't need a Ph.D. in statistics to do this. For most projects, a few simple calculations can tell you a whole lot.
The best place to start is by finding the "middle ground" in your data. These are often called measures of central tendency, but it’s simpler to think of them as finding the most typical response.
- Mean (The Average): This is the one you probably know from school. Just add up all your values and divide by how many you have. If you asked 10 friends about their daily screen time and got these numbers (in hours): 2, 3, 4, 4, 5, 5, 5, 6, 7, and 9, the mean would be 5 hours.
- Mode (The Most Frequent): This is just the number that shows up most often. In that same screen time example, the mode is 5 hours because it appears three times. Easy.
- Median (The Middle Value): If you line up all your numbers from smallest to largest, the median is the one right in the middle. It’s great because one really high or low number won't throw it off. For our screen time data, the median is also 5 hours.
These simple metrics are powerful. Instead of trying to make sense of ten different numbers, you can now confidently say, "The typical screen time for my group was about 5 hours a day." You’ve just taken your first step toward telling a clear story with data.
Analyzing Your Qualitative Data
Working with qualitative data—like notes from an interview or answers to open-ended questions—feels less like math and more like literary analysis. Here, you’re searching for recurring ideas, powerful quotes, and the underlying themes that bring your research to life. The most common way to do this is with thematic analysis.
Thematic analysis is the art of finding patterns in the stories people tell you. It’s about listening for the big ideas that pop up again and again, turning a collection of individual voices into a cohesive narrative.
Let’s say you interviewed five coworkers about their work-from-home experience. As you start reading through your notes, you're not looking for numbers, but for concepts.
First, just read through everything to get a feel for what people said. Then, on your second pass, start "coding" the data by attaching short labels to key ideas. You might highlight one sentence and label it "hates video calls," and another "loves the flexibility."
Once you have a bunch of codes, you can start grouping them into bigger themes. For example, codes like "hates video calls," "feels isolated," and "misses office chatter" could all fall under a broader theme you call "The Downsides of Disconnection." This process helps you move from a mountain of text to a few core findings, like: "While employees love the flexibility, many are struggling with feelings of isolation."
Using AI to Speed Up Your Analysis
Let's be honest: analysis can be the most time-consuming part of any research project. Thankfully, you don't have to do it all by hand. An AI assistant like 1chat can be an incredible partner in this process.
For example, you could upload a long interview transcript and ask it to do some of the heavy lifting for you.
Try prompts like:
- "Summarize the key takeaways from this conversation."
- "What were the top three concerns this person brought up?"
- "Pull out every sentence where the speaker mentions 'flexibility'."
This doesn't replace your own thinking—you still need to interpret the results and decide what’s important. But it can dramatically speed up that initial sorting and coding phase. It helps you quickly spot potential themes and find key quotes, saving you hours of manual effort so you can focus on what the data actually means.
Ensuring Your Research Is Trustworthy: Validity and Ethics
So you've gathered your data and started finding some interesting patterns. That's a huge step! But the job isn't done yet. Great research isn't just about finding answers—it's about making sure those answers are solid and that you treated everyone involved with respect.
This is where we talk about two crucial ideas: validity and ethics.
Think about it like this: you're trying to bake a perfect cake, and your recipe calls for exactly 500g of flour. You grab your kitchen scale. For that scale to be any good, it needs two things.
- Validity asks, "Does this scale actually measure weight accurately?" In research, this means: are you truly measuring what you think you're measuring? If your scale is actually a measuring cup, it has low validity for weighing flour. A survey about "job satisfaction" that only asks about salary probably has low validity, too.
- Reliability asks, "Does this scale give me the same reading every time?" If you weigh the same bag of flour three times and get three different numbers, that scale isn't reliable. In research, this means if someone else followed your exact steps, they should get similar results.
You absolutely need both. An unreliable scale can't be valid, and an inaccurate one is just consistently wrong.
The Guiding Principles of Research Ethics
Beyond just being correct, your research has to be conducted in a way that’s responsible and fair. Ethics are the moral rules of the road that protect the people who help you with your study. Ignoring them can get your work thrown out and, more importantly, cause real harm.
Every researcher, from a student to a seasoned pro, should build their project on these core principles:
- Informed Consent: Your participants need to know exactly what they're signing up for, including any potential discomfort or risks, and agree to it without any pressure. You can't mislead someone into being part of your study.
- Protecting Privacy: You have a responsibility to keep your participants' personal information safe. This usually means making the data anonymous by removing names, email addresses, or anything else that could trace back to a specific person.
- Do No Harm: This is the golden rule. Your project should never cause physical or psychological harm. This includes protecting people from unnecessary stress, embarrassment, or any other negative fallout from participating.
- Transparency: Be straight with your findings. You have to report your results honestly, even if they're not what you were hoping for. Hiding data that doesn't support your theory is a major ethical violation.
Research ethics aren’t just a box-ticking exercise; they are the moral compass for your entire project. The goal is always to seek knowledge while upholding the dignity and safety of others.
An Ethical Checklist for Your Project
Before you even ask your first question, run through this simple checklist:
- Have I clearly explained the study's purpose to my participants?
- Did I get clear, voluntary permission (consent) from everyone?
- How will I store my data to keep it secure and private?
- Have I removed all personal details to make the data anonymous?
- Is there any chance my questions could cause distress or harm?
- Am I ready to share my findings honestly, no matter what they are?
Thinking through validity and ethics makes your work respectable and trustworthy. It's also about giving credit where it's due. For more on properly citing your sources, check out our guide on how to write a bibliography—an essential skill for any ethical researcher.
Your First Research Project: A Simple 7-Step Template
Alright, enough with the theory. The best way to understand research is to actually do it. Let's walk through how to take all these concepts and turn them into a real-world project.
This simple, 7-step plan is your roadmap. It’s designed to take the guesswork out of the process and guide you from a simple question to a finished project without feeling overwhelmed.
Step 1: Define Your Question
This is the most important step, hands down. A great research project starts with a great question—one that is clear, focused, and actually answerable.
Steer clear of questions that are too big, like "What do people think about social media?" Instead, zoom in on something you can realistically investigate. A much better question would be, "What is the average daily screen time for teenagers at my local high school?" See the difference? Specificity is key.
Step 2: Choose Your Design
Once you have your question, you need a plan of attack. This is your research design. Think of it as the blueprint for your study.
Does your question ask "what is happening?" You're looking at a descriptive design. Are you curious about the relationship between two things? That's a correlational design. Or do you want to test whether changing one thing causes an effect on another? That calls for an experimental design.
Step 3: Identify Your Sample
You can't survey the entire world, so you need to choose a representative slice. This group is your sample.
Be specific about who you're going to include. For example, your sample could be "30 regular customers at my family's coffee shop" or "15 families with children under five in my neighborhood." A well-defined sample makes your study manageable.
Step 4: Select Your Data Collection Tools
How are you actually going to get the information you need? Your tools should match your research design.
A simple survey created with a free online tool might be perfect for a descriptive study. If you want to understand people's experiences on a deeper level, you might choose to conduct a handful of in-depth interviews.
No matter which tools you choose, keeping these three pillars in mind—validity (are you measuring what you think you are?), reliability (are your results repeatable?), and ethics (are you being fair and respectful?)—is what makes your findings trustworthy.
Step 5: Gather Your Data
It’s time for action. This is where you'll send out your surveys, sit down for interviews, or begin your observations.
The key here is to stay organized and stick to the plan you made. Most importantly, always protect your participants' privacy and handle their information with care. Good planning in the earlier steps makes this phase run smoothly.
Step 6: Analyze Your Findings
With your data collected, the real fun begins: making sense of it all. This is where you start looking for answers to your question.
If you collected numbers from a survey, you can start by calculating simple stats like averages or percentages. If you conducted interviews, read through your notes and look for common themes, interesting patterns, or powerful quotes that help tell the story.
Step 7: Share Your Story
The final piece of the puzzle is sharing what you learned. A research project isn't complete until you've communicated your findings to others.
This doesn't have to be a stuffy academic paper. It can be a simple slide presentation for your family, a short report for your team, or even a blog post summarizing your question, your process, and what you discovered.
To help you put this all together, we've created a simple planner to get you started. Just fill in the blanks! For a more detailed example, you can also check out our article on how to write a comprehensive research plan.
My First Research Project Planner
Use this simple table as your guide. Answering these questions before you start will give your project a solid foundation and a clear direction.
| Project Step | My Plan / My Answer |
| 1. My Research Question | What specific, focused question am I trying to answer? |
| 2. My Research Design | Will my study be descriptive, correlational, or experimental? |
| 3. My Sample | Who, specifically, will I be studying? How many people will I include? |
| 4. My Data Collection Tools | What will I use to gather information (e.g., surveys, interviews)? |
| 5. My Data Gathering Plan | How, when, and where will I collect the data? |
| 6. My Analysis Plan | How will I look for patterns and meaning in my data? |
| 7. My Sharing Plan | How and with whom will I share my final findings? |
Once you've filled this out, you'll have a complete, one-page plan ready to go. You're no longer just learning about research—you're ready to be a researcher.
Common Questions About Research Methodology
As you get ready to dive into your first research project, it's totally normal for a few questions to be rattling around in your head. Let's tackle some of the most common ones I hear from people just starting out. The goal here is to give you clear, practical answers that build your confidence.
How Do I Know if I Should Use Quantitative or Qualitative Research?
This is probably the first big decision you'll face, but the answer always points back to your research question. Think of your question as your North Star—it guides every choice you make.
- Choose Quantitative if: Your question is about numbers. If you need to find out "how many," "how often," or want to compare things that can be measured, you're in quantitative territory. This approach is all about testing, measuring, and getting objective data.
- Choose Qualitative if: Your question is about the "why" or the "how." When you want to understand someone's experience, dig into their motivations, or get the rich story behind a phenomenon, you need qualitative methods. This is for exploring ideas and understanding context.
A simple way to think about it is: will statistics prove my point, or will powerful quotes and detailed stories explain it best? Honestly, some of the most compelling research actually uses a mix of both.
Can I Do Real Research Without a Big Budget?
Absolutely. You don't need a huge budget to conduct meaningful research. The strength of your study comes from a solid, systematic plan and clear thinking—not from the amount of cash you throw at it.
You can run great quantitative studies using free survey tools. For qualitative work, just a handful of well-planned, deep interviews can yield incredibly rich insights. A strong research methodology for beginners is built on being organized and resourceful, not on having deep pockets.
The most common mistake new researchers make is jumping straight into data collection without a solid plan. They get excited and send out surveys, only to find later that they've collected messy, irrelevant information.
What Is the Most Common Mistake Beginners Make?
I see it all the time: people get so excited to find answers that they rush into the "doing" before they've finished the "thinking." The single biggest pitfall is launching into data collection without a crystal-clear research question and a simple, step-by-step methodology.
This almost always leads to wasted time and effort. You end up with a pile of data that doesn't actually answer your question, and you're left feeling frustrated.
A few hours spent carefully refining your question and mapping out your plan will save you weeks of headaches later on. Your plan is your most valuable asset—always start there.